


Various photographs // Shutterstock
Average home sale price in the US approaches one million dollars in higher-priced real estate markets
Panoramic view of urban sprawl in San Jose, Silicon Valley, California at night. Visible light trail from cars driving on one of the freeways.
While the median home sales price in the U.S. is just under $421,000 in the first quarter of 2024, home prices in some areas are more than double that. These expensive areas may discourage hopeful first-time buyers from investing in the area, making renting – or even moving to a less expensive area – a better alternative. In some cases, high wages and demand are keeping pressure on a meager home supply.
With this in mind, SmartAsset evaluated the 100 largest metropolitan areas based on average home sales prices in April 2024 to determine the most and least favorable locations for home buyers.
Key findings
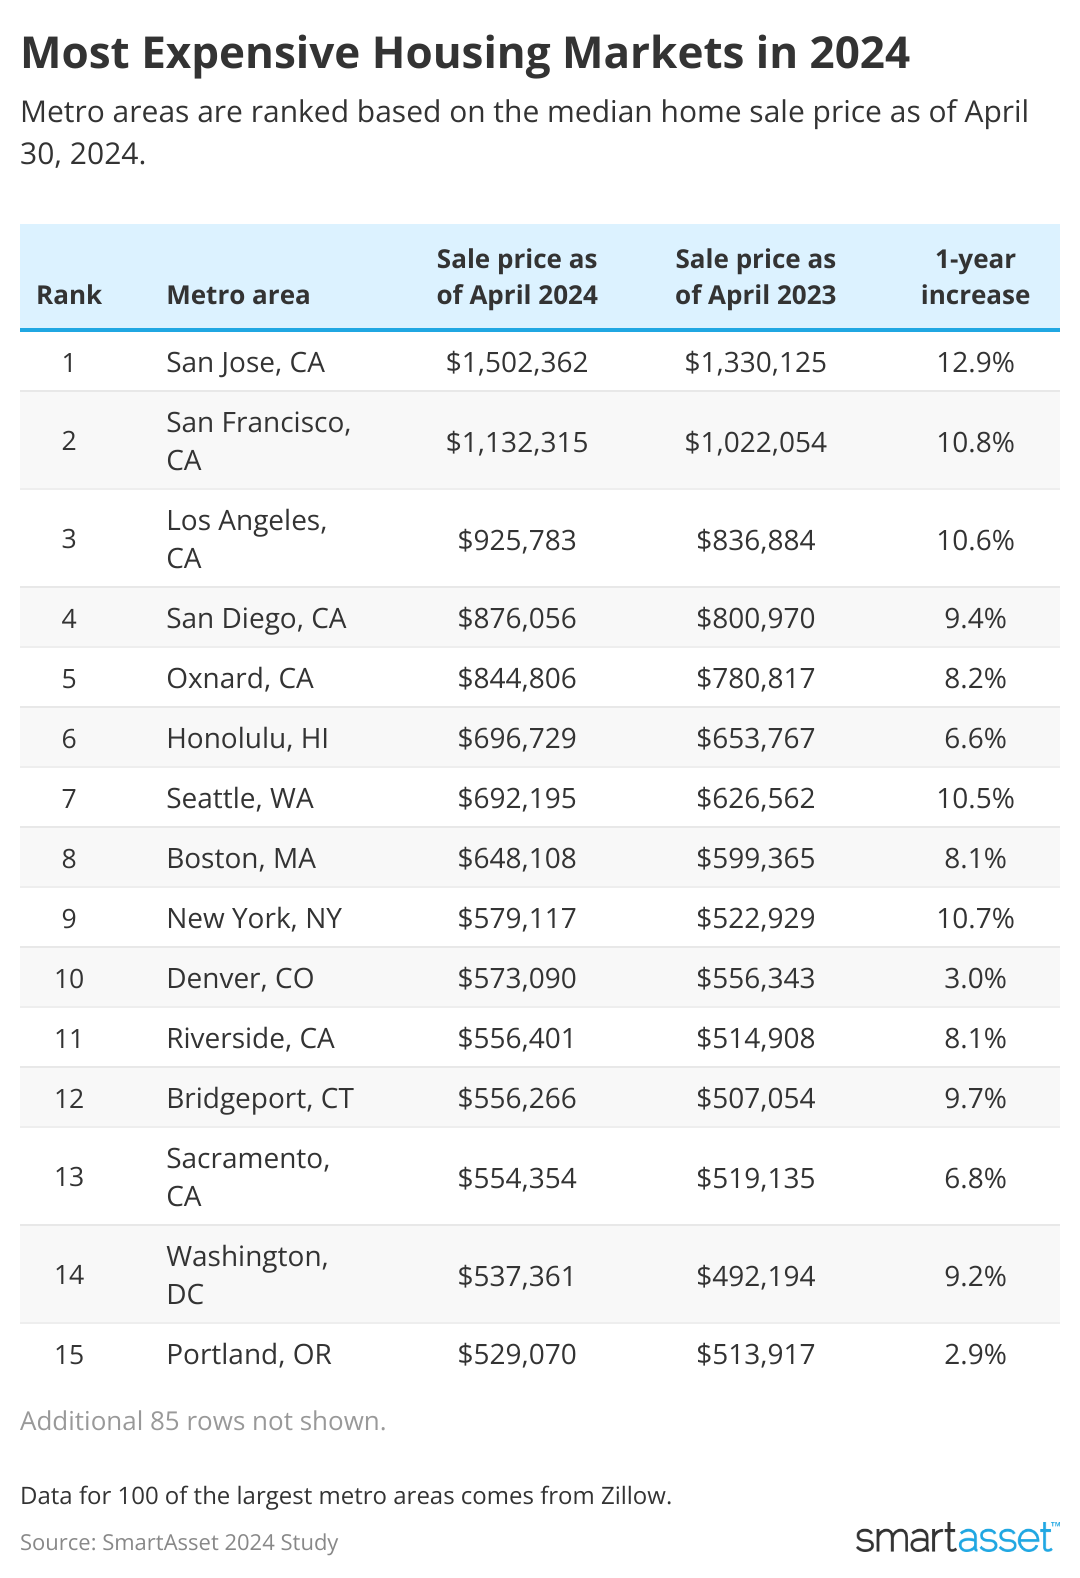
- California’s major cities occupy the top five places in the most expensive real estate markets. Home values in first-place San Jose are more than double those in sixth-place Honolulu. The average sales price in San Jose was $1.50 million in April 2024, up 12.9% from the previous year. San Francisco ($1.13 million), Los Angeles ($926,000), San Diego ($876,000) and Oxnard ($845,000) rank second through fifth.
- In four major Ohio cities, homes are selling for less than $200,000. These homes top the list of the cheapest homes. In 2024, homes in Toledo cost an average of $157,176, in Akron $177,000, in Dayton $187,000, and in Cleveland $187,000.
- Real estate prices have risen by more than 50% since before the pandemic. Over the past five years, home prices in major metropolitan areas have increased by 51.3%. Knoxville, Tennessee, saw the largest increase during that time at 89.5%, while Honolulu saw the smallest relative increase in home prices at 23.4%.
- New York City is moving up the rankings. In just one year, the New York metro area jumped from 12th to 9th most expensive place. In April 2024, homes sold for about $579,000, an annual increase of 10.7%. In all major metropolitan areas, real estate prices rose by an average of 6% during the same period.
![]()
SmartAsset
The 10 most expensive real estate markets
Table with the most expensive real estate markets in 2024
- San Jose, California
- Average home sale price as of April 30, 2024: $1,502,362
- Price increase over one year: 12.9%
- Average home sale price as of April 30, 2023: $1,330,125
- Price increase over five years: 41%
- Average home sale price as of April 30, 2019: $1,065,478
- San Francisco, California
- Average home sale price as of April 30, 2024: $1,132,315
- Price increase over one year: 10.8%
- Average home sale price as of April 30, 2023: $1,022,054
- Price increase over five years: 30.5%
- Average home sale price as of April 30, 2019: $867,728
- Los Angeles, California
- Average home sale price as of April 30, 2024: $925,783
- Price increase over one year: 10.6%
- Average home sale price as of April 30, 2023: $836,884
- Price increase over five years: 47.9%
- Average home sale price as of April 30, 2019: $625,807
- San Diego, California
- Average home sale price as of April 30, 2024: $876,056
- Price increase over one year: 9.4%
- Average home sale price as of April 30, 2023: $800,970
- Price increase over five years: 55.1%
- Average home sale price as of April 30, 2019: $564,895
- Oxnard, California
- Average home sale price as of April 30, 2024: $844,806
- Price increase over one year: 8.2%
- Average home sale price as of April 30, 2023: $780,817
- Price increase over five years: 43%
- Average home sale price as of April 30, 2019: $590,774
- Honolulu, Hawaii
- Average home sale price as of April 30, 2024: $696,729
- Price increase over one year: 6.6%
- Average home sale price as of April 30, 2023: $653,767
- Price increase over five years: 23.4%
- Average home sale price as of April 30, 2019: $564,630
- Seattle, Washington (State)
- Average home sale price as of April 30, 2024: $692,195
- Price increase over one year: 10.5%
- Average home sale price as of April 30, 2023: $626,562
- Price increase over five years: 53%
- Average home sale price as of April 30, 2019: $452,324
- Boston, Massachusetts
- Average home sale price as of April 30, 2024: $648,108
- Price increase over one year: 8.1%
- Average home sale price as of April 30, 2023: $599,365
- Price increase over five years: 47.9%
- Average home sale price as of April 30, 2019: $438,282
- New York, NY
- Average home sale price as of April 30, 2024: $579,117
- Price increase over one year: 10.7%
- Average home sale price as of April 30, 2023: $522,929
- Price increase over five years: 49.2%
- Average home sale price as of April 30, 2019: $388,273
- Denver, Colorado
- Average home sale price as of April 30, 2024: $573,090
- Price increase over one year: 3%
- Average home sale price as of April 30, 2023: $556,343
- Price increase over five years: 45.3%
- Average home sale price as of April 30, 2019: $394,302
The 10 metropolitan areas with the cheapest housing markets
- Toledo, Ohio
- Average home sale price as of April 30, 2024: $157,176
- Price increase over one year: 16.4%
- Average home sale price as of April 30, 2023: $135,009
- Price increase over five years: 33.2%
- Average home sale price as of April 30, 2019: $118,029
- Akron, Ohio
- Average home sale price as of April 30, 2024: $176,757
- Price increase over one year: 3.8%
- Average home sale price as of April 30, 2023: $170,290
- Price increase over five years: 26.6%
- Average home sale price as of April 30, 2019: $139,667
- Scranton, Pennsylvania
- Average home sale price as of April 30, 2024: $180,387
- Price increase over one year: 0.2%
- Average home sale price as of April 30, 2023: $179,971
- Price increase over five years: 49.7%
- Average home sale price as of April 30, 2019: $120,539
- Dayton, Ohio
- Average home sale price as of April 30, 2024: $186,913
- Price increase over one year: 8.9%
- Average home sale price as of April 30, 2023: $171,664
- Price increase over five years: 46.9%
- Average home sale price as of April 30, 2019: $127,199
- Cleveland, Ohio
- Average home sale price as of April 30, 2024: $187,413
- Price increase over one year: 5.7%
- Average home sale price as of April 30, 2023: $177,352
- Price increase over five years: 36.2%
- Average home sale price as of April 30, 2019: $137,615
- McAllen, Texas
- Average home sale price as of April 30, 2024: $194,858
- Price increase over one year: 1%
- Average home sale price as of April 30, 2023: $192,890
- Price increase over five years: 32.8%
- Average home sale price as of April 30, 2019: $146,774
- Syracuse, New York (State)
- Average home sale price as of April 30, 2024: $202,329
- Price increase over one year: 7.3%
- Average home sale price as of April 30, 2023: $188,497
- Price increase over five years: 45.2%
- Average home sale price as of April 30, 2019: $139,370
- Pittsburgh, Pennsylvania
- Average home sale price as of April 30, 2024: $206,620
- Price increase over one year: 8.3%
- Average home sale price as of April 30, 2023: $190,855
- Price increase over five years: 34.7%
- Average home sale price as of April 30, 2019: $153,409
- Little Rock, Arkansas
- Average home sale price as of April 30, 2024: $213,760
- Price increase over one year: 3.4%
- Average home sale price as of April 30, 2023: $206,806
- Price increase over five years: 43.1%
- Average home sale price as of April 30, 2019: $149,363
- Rochester, New York (State)
- Average home sale price as of April 30, 2024: $216,291
- Price increase over one year: 10.6%
- Average home sale price as of April 30, 2023: $195,542
- Price increase over five years: 52.9%
- Average home sale price as of April 30, 2019: $141,458
Data and methodology
This study examined home sales data for 100 of the largest metropolitan areas in the U.S. to determine the most expensive and least expensive real estate markets. Data for April 2024, 2023, and 2019 is from Zillow for single-family homes, condos, and co-ops.
This story was produced by SmartAsset and reviewed and distributed by Stacker Media.
