A Reddit poster, misken67, has shared some fascinating and informative visualizations of recent Metro and BRT ridership numbers. SBLA shares misken67’s maps, charts, and insights below, but if you’re interested in this kind of ridership detail, you should head over to the original /LAMetro subreddit posts with maps and charts.
Many SBLA readers are aware that Metro ridership has steadily increased over the past two years and is expected to soon fully recover from the losses suffered at the beginning of the pandemic.
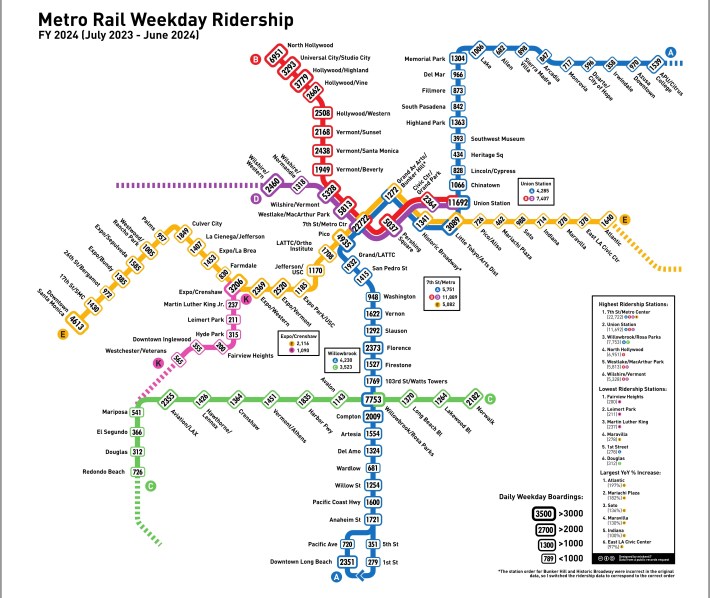
For the last two fiscal years, misken67 has collected detailed Metro ridership numbers by station, which provide insight into recent trends. Below are the ridership numbers for fiscal years 2022-23 and 2023-24 by station. (Click on the images to enlarge them – or follow the links to Reddit posts for the best resolution.)

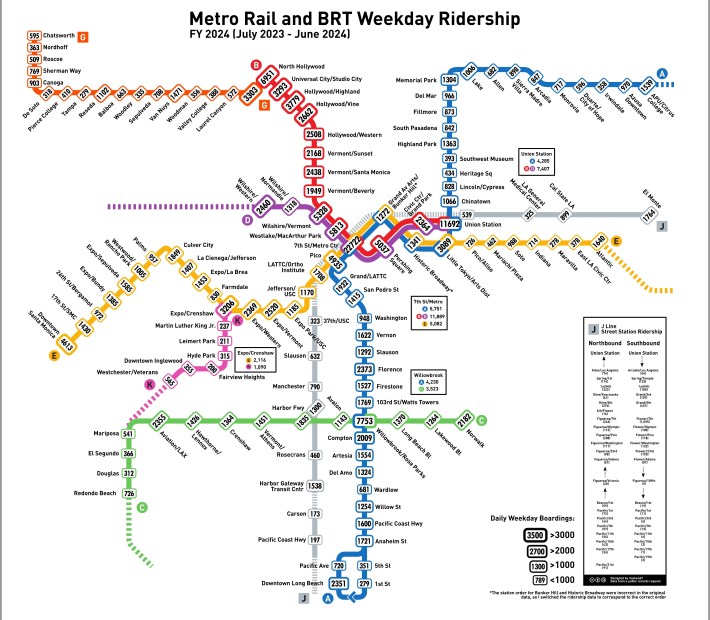
Here is a map that also includes the Bus Rapid Transit (BRT) lines.
Misken67’s ridership by station includes a detailed explanation of the trends observed. Here is their TLDR summary of trends for FY 2024:
New infrastructure (Regional Connector and K Line) is doing great. Strong recovery post-Covid in general and especially strong recovery at stations that were affected by closures in previous years. Few light rail stations have lost ridership, but almost all commuter rail stations have. 7th/Metro Center is a beast.
Below are some more specific observations from the original post. First, the positive:
- Little Tokyo is already seeing (slightly) more ridership than in 2019 before the closure.
- The Eastside A Line is recovering quickly after being cut off from the rest of the system for several years. Six of the seven ELA stations were among the six stations with the largest year-over-year percentage increases, with Atlantic seeing a whopping 197 percent increase.
- After the Eastside A-Line stations, the next four top ten stations with the largest increases are all K-Line stations, with Inglewood performing best with an increase of 95 percent.
- 7th/Metro is an insane workhorse. I believe those numbers make it the highest-ridership transit station in the U.S. west of the Mississippi (only BART’s Embarcadero station rivals it).
And some negatives:
- Seven light rail stations have lost riders since fiscal year 2023. Four of them were on the section of Line C between Mariposa and Redondo Beach, which was temporarily closed this year.
- All commuter rail stations (B/D Red/Purple Lines) except Universal lost ridership. Some of this is due to the Regional Connector eliminating transfers (Union Station down 30 percent, Civic Center down 25 percent, and Pershing Square down 15 percent), and some of it appears to be due to temporary construction closures on the D Line extension (Wilshire/Western down 29 percent). The SBLA addressed the B/D Line ridership issues in late 2023 (these subway lines carry a lot of ridership but have been slow to recover from pandemic-related losses).
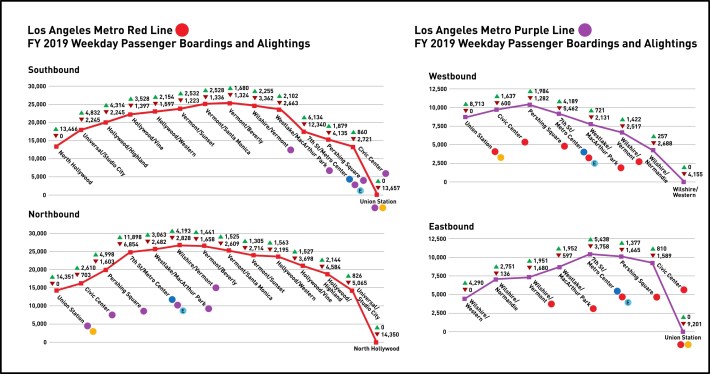
Misken67 has also published charts of weekday ridership for several subway lines. These charts use station data to show how many passengers are on board each line.
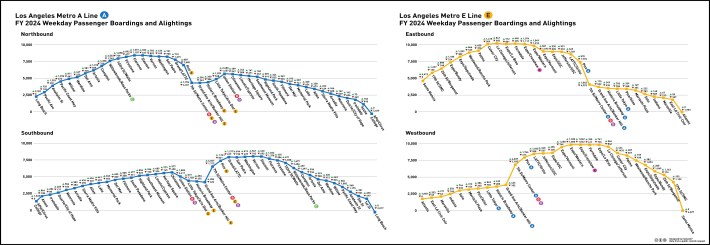
Read misken67’s observations, which include a strong demand for full signal priority for trains with lots of people:
- The E Line from West LA to Downtown LA is the busiest segment of the entire LRT (light rail) system.
- The second busiest segment is the A Line in South LA – from Downtown LA to the C Line.
- At certain intersections in South LA (near USC), 17,000 to 19,000 Metro riders wait while the city prioritizes 350 to 400 to maybe 1,000 cars. Specifically, misken67 calls on the city’s Department of Transportation (LADOT): “These are all intersections that should be closed to cars, or where trains should at least have absolute signal priority. With this low level of car traffic, there is no danger of traffic or congestion, and this point is simply an insult to passengers.”
Most recently, misken67 also shared the capacity utilization figures before the pandemic for lines B and D.