

- Natural gas stabilizes above $2.13 and holds support
- Markets expect Europe to prepare for the next heating season while New Zealand faces major problems.
- The US dollar index is seeing a slight inflow due to risk aversion ahead of Nvidia.
Natural gas is trading at $2.17 per MMBtu at the time of writing. Natural gas prices (XNG/USD) remain in a clear range between $2.13 and $2.36 for most of August. Demand still looks bleak as Europe and China have less need for liquefied natural gas (LNG). Meanwhile, New Zealand is quickly lifting an LNG import ban and accelerating LNG projects to solve the current energy crisis.
Meanwhile, the US dollar index (DXY), which tracks the greenback’s value against six other major currencies, is still trying to recover from one of its worst weeks in nearly a year. The US dollar seems to have some support and may even be seeing a slight inflow again as some nervousness prevails ahead of Nvidia’s earnings release later on Wednesday after the US market closes. Any underperformance from the tech giant could trigger a sell-off in equities and lead to further US dollar inflows.
Natural gas is trading at $2.17 per MMBtu at the time of this writing.
Natural gas news and market drivers: New Zealand’s energy problems
- Bloomberg reports that Norwegian gas exports to Europe are at a two-month low. The main reason for the drop in deliveries is seasonal maintenance work in Norway.
- Reuters reports from Australia that Inpex has cancelled at least four LNG shipments scheduled for next month from its Ichthys facility due to an ongoing disruption.
- Reuters reports that the New Zealand government has announced plans to lift a six-year-old ban on issuing oil and gas permits and speed up an LNG import project. The country has been battling severe power outages in recent months.
- The recent retaliatory measures and the deployment of a new ballistic missile to Ukraine could lead Russian President Vladimir Putin to even consider cutting off Europe’s gas supplies completely.
Technical analysis for natural gas: Not much is moving
Natural gas prices have eased again after a rather volatile summer. With a ceasefire agreement for the Gaza region and Israel on the table, European gas storage facilities over 90% full and demand in China sluggish, there are not many catalysts for a significant increase in gas prices. It looks as if gas prices will remain in this sideways movement for some time until a new catalyst comes along that causes unrest.
If more bullish headlines emerge and push the price of gas higher, look for moving averages as upside resistance. First, the 200-day SMA (Simple Moving Average) and 55-day SMA at $2.30 and $2.36 would already be significant upside moves. Further up, the 100-day SMA at $2.41 could be tested.
On the downside, pressure is mounting to $2.13 for another drop. If this level is breached, $2.00 will come back into play for a test and possible drop below it. Although it is still a long way off, a return below $2.00 could mean a test of the August low, with $1.93 on the horizon.
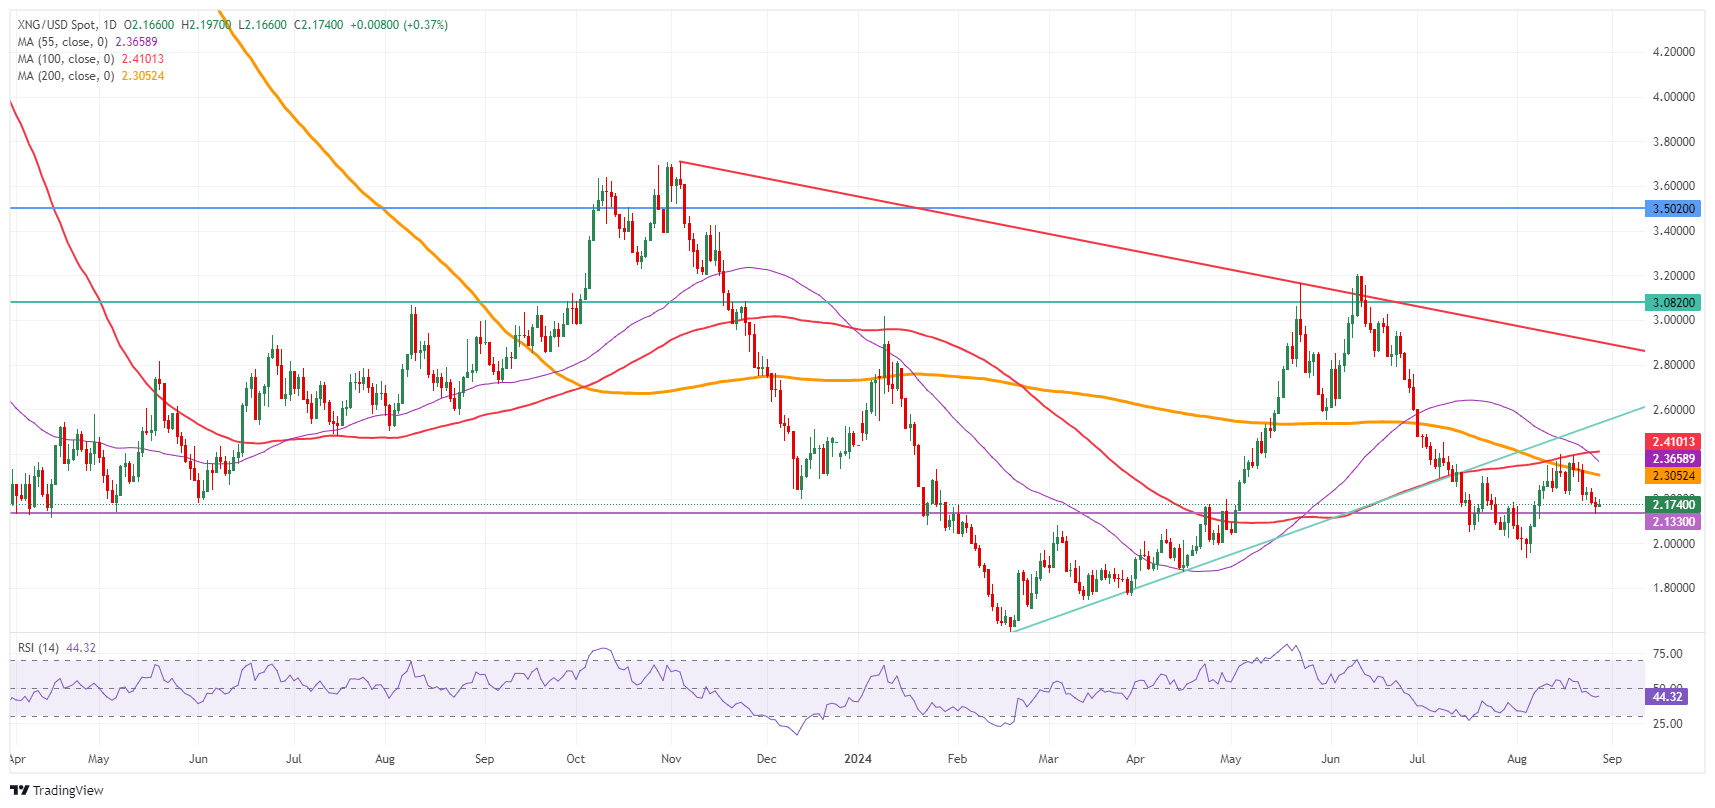
Natural gas: daily chart
Frequently asked questions about natural gas
Supply and demand dynamics are a major factor affecting natural gas prices. They are in turn influenced by global economic growth, industrial activity, population growth, production levels and inventories. Weather affects natural gas prices as more gas is used for heating and cooling in cold winters and hot summers. Competition from other energy sources affects prices as consumers may switch to cheaper sources. Geopolitical events are factors, such as the war in Ukraine. Government policies on extraction, transportation and environmental issues also affect prices.
The main economic release that affects natural gas prices is the weekly inventory bulletin from the Energy Information Administration (EIA), a US government agency that produces data on the US gas market. The EIA’s gas bulletin is usually released on Thursdays at 14:30 GMT, a day after the EIA releases its weekly oil bulletin. Economic data from major natural gas consumers can affect supply and demand. The largest consumers include China, Germany and Japan. Natural gas is primarily traded and priced in US dollars, so economic releases that affect the US dollar are also factors.
The US dollar is the world’s reserve currency and most commodities, including natural gas, are priced and traded in international markets in US dollars. Therefore, the value of the US dollar is a factor in the price of natural gas because when the dollar strengthens, fewer dollars are needed to buy the same amount of gas (the price falls), and vice versa when the USD strengthens.
