
Join Cost Management Solutions for a free 30-minute Virtual Hedging Webinar on Tuesday, August 27 at 10 a.m. CDT. Register here.
Trader’s Corner, a weekly collaboration with Cost Management Solutions, analyzes propane supply and price trends. This week, Mark Rachal, Director of Research and Publications, discusses the variability of import and export data to put the impact of the Canadian rail strikes into context.
Read last week’s Trader’s Corner here: Propane stocks exceed 90 million barrels
This week in Trader’s Corner we will cover a couple of largely unrelated topics that have been of interest this week. One of them concerns propane imports and the other concerns propane exports. We want to put the two events in the proper context.
Canadian rail strike
We saw a one-day spike in propane prices this week as rumors began to swirl about the impending Canadian railroad strike. The U.S. doesn’t import much propane right now because domestic production is so high. However, we do receive some imports, mostly from Canada.

Figure 1: Total US propane imports as of 2019
Propane imports account for about 4 percent of the U.S. propane supply. Still, markets abhor uncertainty, and the rail strike could have potentially caused some problems. However, the market largely dismissed it after one day. Both of Canada’s major railroads went on strike at the same time, which was unprecedented. The government has since intervened, and Canadian National Railway workers are returning to their jobs. Canadian Pacific Kansas City workers are continuing to strike for now.
Although the potential impact on propane markets is small and half of the potential impact has already been avoided, some buyers of Canadian propane shipped by rail will be affected. Although traders seem to have written off the event, it still made us curious how much propane is coming into the U.S. from Canada by rail. Typically, when looking at imports, we focus on the total volume from all sources and all modes of transportation, so we wanted to focus only on volumes from Canada by rail.
The following data comes from the National Energy Board (NEB) of Canada:
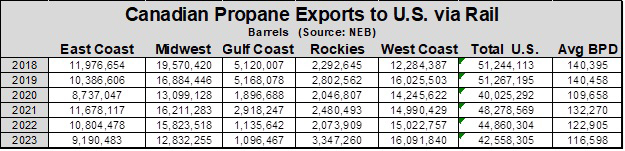
Table 1: Canadian propane gas exports to the USA by rail
The amount of Canadian propane entering the U.S. by rail is declining. Last year, volumes were 17 percent lower than in 2018. During that period, the Rockies and West Coast saw increases in volumes, but these were more than offset by declines in other regions. In the Rockies and West Coast, total volumes have increased by nearly 5 million barrels since 2018. The Midwest saw a decline of 6.7 million barrels, or 34 percent, and the Gulf Coast saw a decline of 4 million barrels, or 79 percent.
Even at the reduced rate of 116,598 barrels per day in 2023, that averaged about 54 rail cars of propane per day. Again, the potential loss of that volume may not be enough on a macro level to upset the entire propane market, but it can certainly cause problems for a propane trader expecting one of those rail cars filled with 90,000 gallons of propane. It’s worth noting that rail shipments accounted for 93 percent of total U.S. propane imports from all sources and origins in 2023. Pipelines that used to bring propane from Canada to the U.S. have largely been reversed, primarily to bring diluents to Canada to mix with heavy crude oil, thereby making it more fluid.
It is also worth noting that prior to 2019, there was no capacity in Canada for shipboard exports of propane. The expansion of shipboard facilities on Canada’s west coast has opened up an Asian market for propane exports. Last year, shipboard exports totaled 30,022,535 barrels, rapidly approaching the volumes of propane shipped to the United States.
Large export figures
For the week ending August 16, the US Energy Information Administration (EIA) reported US propane exports of 2.009 million barrels per day (bpd). It was only the eighth time that exports of over 2 million bpd were reported in a week. The highest reported figure was 2.335 million bpd in April.
It wasn’t so much the export volume that prompted us to write about it, but the dramatic changes in volume week-over-week and the corresponding drop in domestic demand. Exports increased by 492,000 bpd week-over-week. At the same time, U.S. demand fell by 429,000 bpd. Remember, domestic demand for propane is a calculated number. The EIA collects information on propane exports, imports, production and inventory changes, then calculates what domestic demand must have been for the numbers to balance.
Do we believe domestic demand fell 429,000 bpd in one week? No. Do we believe exports were 2 million bpd? No. Mainly because we believe our sustainable export capacity is about 1.8 million bpd. We believe the dramatic fluctuations in exports and why they sometimes exceed capacity has to do with the timing of reporting to the EIA. The EIA has reported an average of 1.730 million bpd of propane exports and 979,000 bpd of domestic demand this year. We believe these numbers reflect the true situation.
So why are there such big fluctuations in EIA’s reports each week? A little context can help here. The capacity of the very large gas carriers (VLGCs) used extensively to export U.S. propane is staggering. A look at the ship records shows a single ship carrying 590,000 barrels. Cargoes between 540,000 and 575,000 barrels are common.
Two of these ships alone could carry more propane than the average daily domestic demand of the entire United States. So how do we get 492,000 bpd in exports and 438,000 bpd in domestic demand in one week? All it takes is a small weekly variation in the timing of ship reports sent to the EIA.
That’s why when we report on domestic demand and exports for propane, we add trend lines to filter out the weekly volatility and focus on the overall situation and trend. Look at the charts for both below and notice how hard it is to make out anything in the patchy weekly numbers, and how much clearer the picture is when you focus on the trend lines.
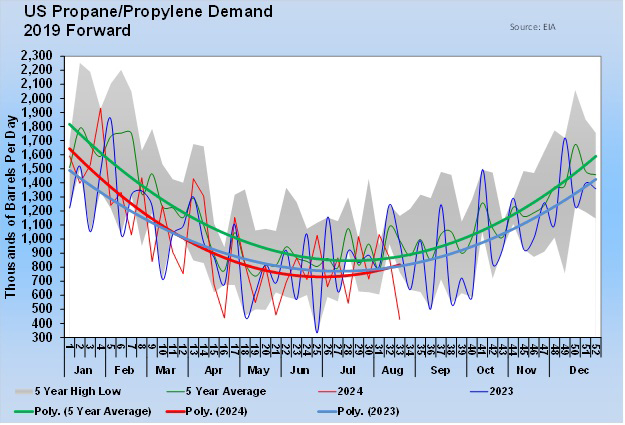
Figure 2: US propane/propylene demand from 2019
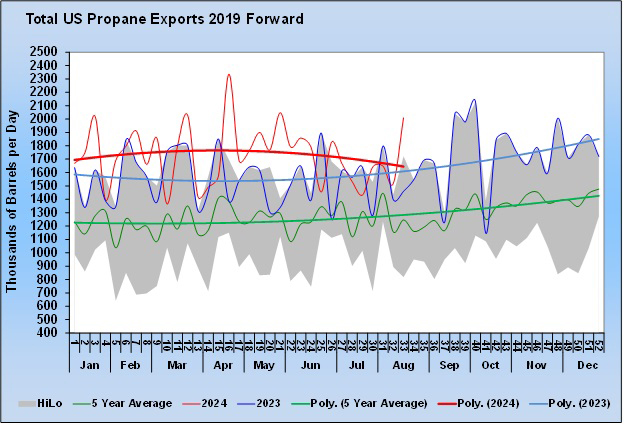
Figure 3: Total US propane exports as of 2019
Without trend lines, it would be difficult to figure out how domestic demand or exports are doing. Despite the just reported 2 million bpd of exports, propane exports have been trending downward lately, which is fueling the recent increase in propane inventories. Although exports are higher than last year, they have recently been trending in the opposite direction to both last year and the five-year average, which is useful to know.
We hope that the information on volumes, trends and variability in imports and exports in this Trader’s Corner will help you provide a better context for assessing the impact of these events.
All diagrams courtesy of Cost Management Solutions
Call Cost Management Solutions today at 888-441-3338 or email us at [email protected] for more information on how customer service can improve your business.
